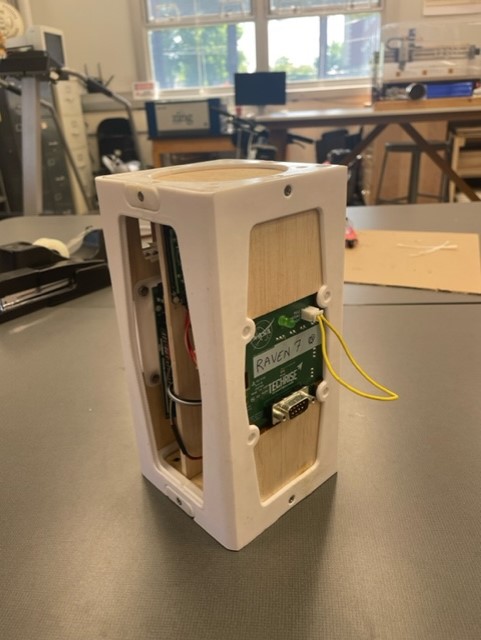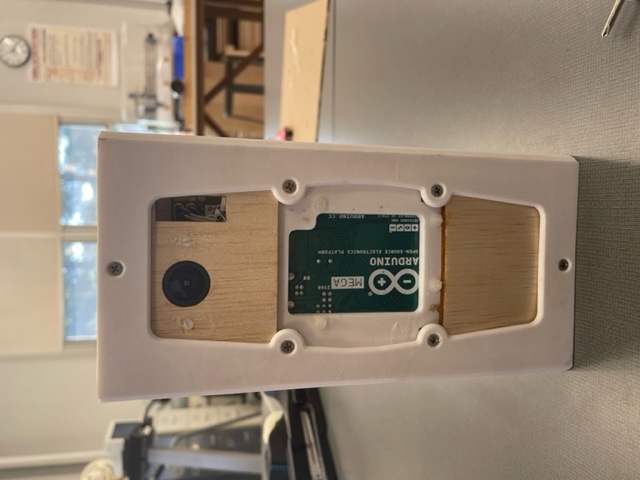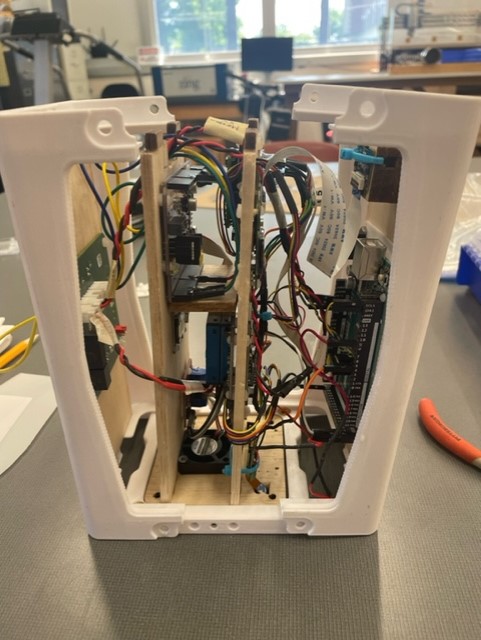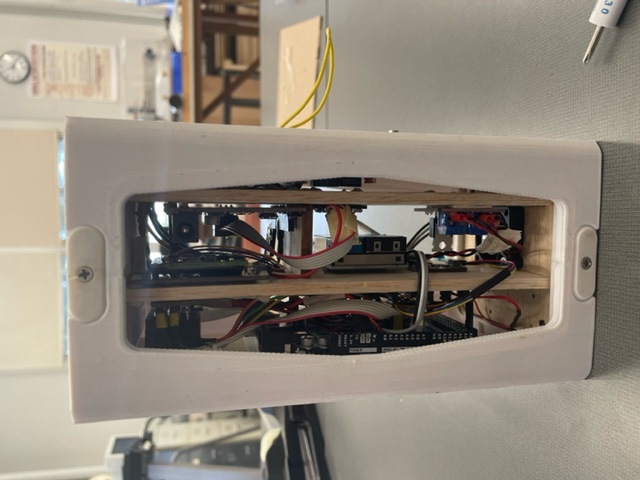

Atmospheric Measurement Of Noxious Gases Using Sensors (A.M.O.N.G.U.S.) is an experiment that attempts to detect greenhouse gases and air particle levels. We are developing an instrumentation package that includes sensors for measuring air particle concentration, CO2 concentration, temperature, humidity, and pressure. A fan is utilized to expose our sensors to direct air flow and ensure that new air samples enter the center chamber. Throughout the flight, our cameras will be recording videos and taking photos. The sensors are powered by the Arduino Mega, and the telemetry data is collected by the Metro M4 microcontroller. All data collected will be retained on our SD card modules from our 4 hour flight on the high altitude balloon from South Dekota.
Materials
- Arduino Mega 2560 Rev3
- Adafruit Metro M4
- Adafruit SCD-30 - NDIR CO2 Temperature and Humidity Sensor - STEMMA QT / Qwiic
- Adafruit CCS811 Air Quality Sensor Breakout - VOC and eCO2 - STEMMA QT / Qwiic-4 (Primary VOC + CO2 Backup Sensor)
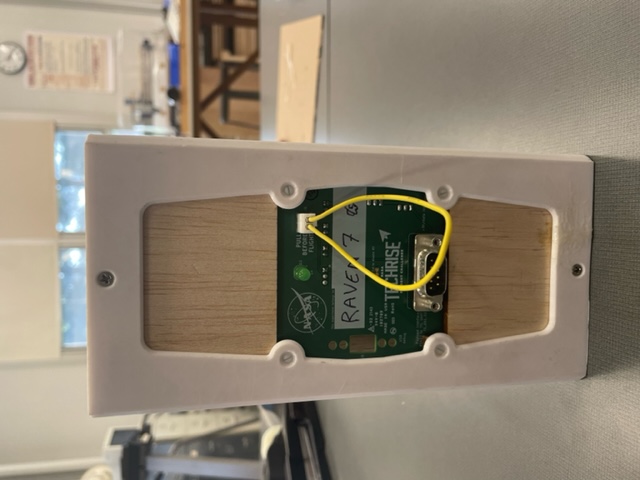
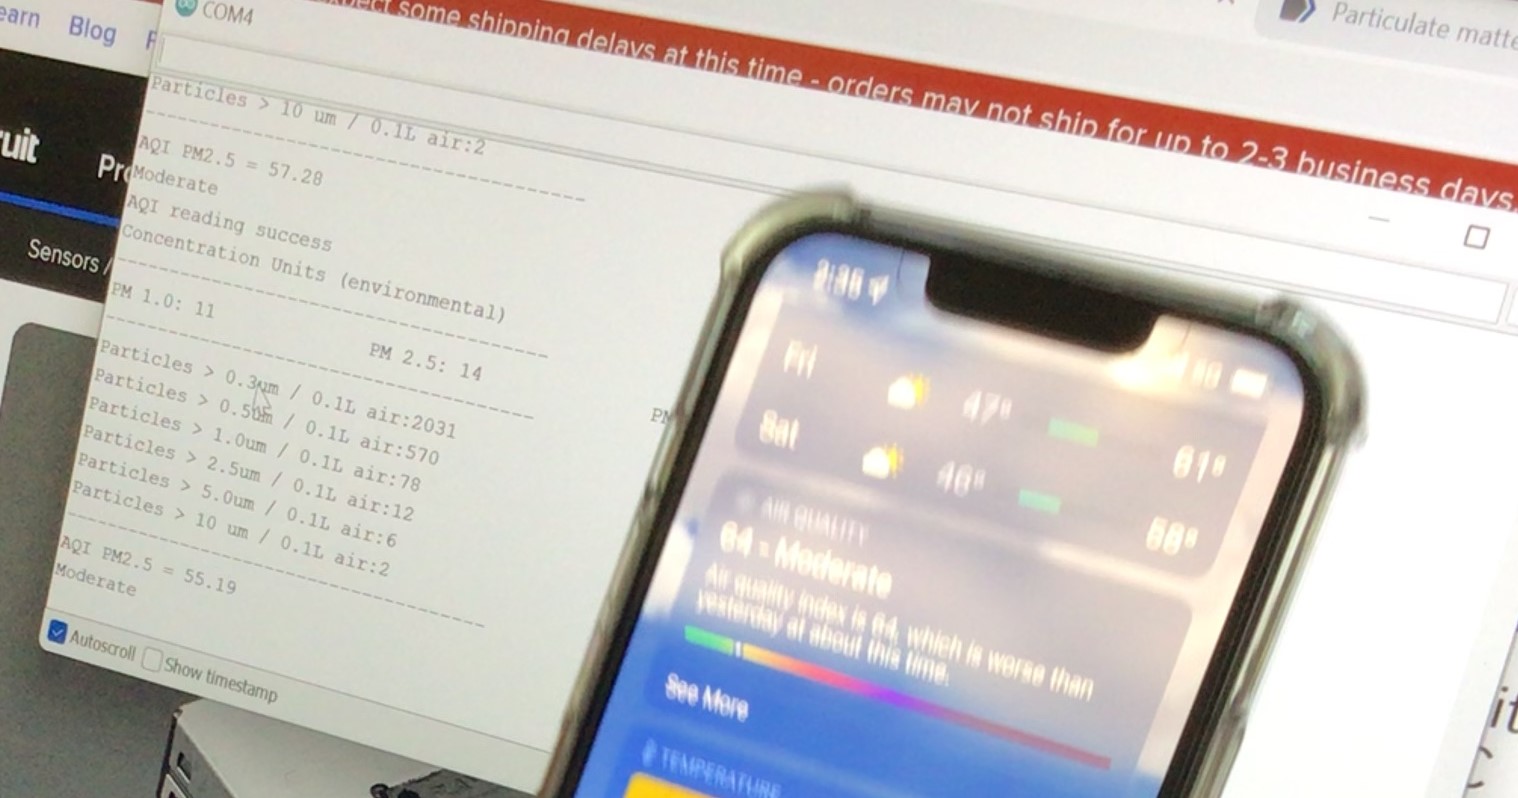
- Adafruit PMSA003I Air Quality Breakout - STEMMA QT / Qwiic (Particulate Sensor)
- Adafruit DPS310 Precision Barometric Pressure / Altitude Sensor - STEMMA QT / Qwiic
- 32G MicroSD Memory Card
- 64G MicroSD Memory Card (DashCam)
- AiTrip 3PCS MicroSD Card Module (Arduino Mega)
- Adafruit MicroSD Card Breakout Board+ (Metro M4)
- Circulation Fan
- N-Channel MOSFET Module (IRLB 8721) - To Control Fan
- Showasaki Dash Cam USB 1080P
- Adafruit Mini Spy Camera
- Custom I2C Hub
- Custom SPI Hub
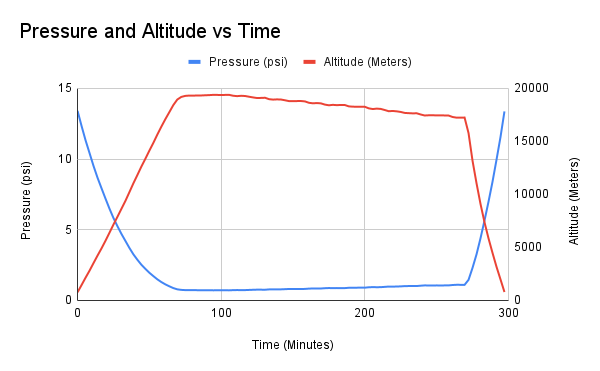
 Pressure vs Time.png)
 Pressure vs Time.png)